Ultimate Guide to the Demographic Transition Model: Stages and Examples
Exploring the Amazing World of Population Growth
Have you ever stopped to think about why some countries have millions of people while others stay small? The answer is found in a helpful tool called the demographic transition model. This model acts like a special map that shows how a nation’s population changes as it grows. It tracks how many babies are born and how many people pass away over many years. By looking at these numbers, we can see how a society moves from simple farming to busy city life.
Understanding our world starts with looking at how we live and grow as a global family. The demographic transition model is not just about numbers on a dusty page in a library. It is actually a story about human progress and how we solve big problems like hunger and sickness. In this guide, we will explore every part of this journey in a way that is very easy to grasp. We will see how medicine and schools change the way we live our daily lives.
What is the Demographic Transition Model in Simple Words?
If you are looking for a clear demographic transition model definition, imagine a simple graph with two lines. One line shows the birth rate, and the other line shows the death rate in a country. As a country builds better roads, hospitals, and schools, these two lines start to move in very interesting ways. Usually, the death rate drops first because people get better medicine. Later, the birth rate drops because families choose to have fewer children while living in big, modern cities.
Many people ask what is the demographic transition model used for by leaders and scientists today? It helps them plan for the future so everyone has enough food, water, and jobs to stay happy. By using this model, we can predict if a country will need more schools for kids or more doctors for seniors. It is like a weather forecast but for the people living in a nation. It makes the complex world feel much more organized and easier to understand for everyone.
Key Benefits of the Model:
- Predicts Future Trends: Helps governments plan for housing and healthcare needs.
- Identifies Economic Status: Shows how wealthy or developed a nation has become.
- Guides Business Decisions: Companies use it to find new markets for their products.
- Simple Visualization: Turns complex math into a clear and easy-to-read graph.
- Global Comparison: Allows us to compare different countries using the same rules.
The Official Definition for Academic Success
When we talk about the demographic transition model definition ap human geography students use, it gets more specific. It is a theory that describes a transition from high birth and death rates to low birth and death rates. This change usually happens as a country develops from a pre-industrial to an industrialized economic system. It is a core concept that helps us group countries based on their social health. Knowing this definition is the first step to mastering how our global society functions every day.
For any student studying demographic transition model ap human geography themes, remember that this model is a general guide. While most countries follow these steps, some might move faster than others due to unique history or laws. The model serves as a “best-fit” line for the busy and often chaotic lives of billions of people. It helps geographers see why some places are young and energetic while others are older and more settled. It is a powerful tool for anyone curious about our planet’s future.
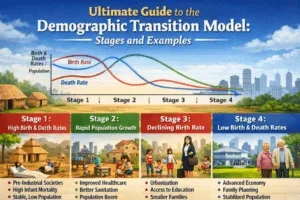
Stage 1: The Era of High Births and High Deaths
In the first of the demographic transition model stages, life was very different for humans for thousands of years. Both the birth rate and the death rate were very high and stayed close together on the graph. This meant that the total population did not grow very much at all during this time. People had many children because many did not survive to become adults due to a lack of medicine. There were no modern hospitals, and simple germs could be very dangerous for everyone.
Today, there are no entire countries left in Stage 1, which is great news for our world! It means every nation has improved its healthcare enough to save more lives than in the past. However, some very remote groups of people might still live in conditions that look like this stage. It was a time defined by a struggle for survival against nature and disease. While it was a difficult era, it was the foundation of human history before modern technology changed our lives.
Characteristics of Stage 1:
- High Birth Rates: Families had many children to help with farming and chores.
- High Death Rates: Disease and lack of clean water caused many people to pass away.
- Low Growth: The population stayed small and stable for a very long time.
- Limited Medicine: People relied on traditional methods instead of modern doctors.
- Agricultural Focus: Almost everyone lived on farms and grew their own food.
Stage 2: The Period of Rapid Population Growth
Stage 2 is when a country takes a giant leap forward in its health and technology. The death rate starts to drop very quickly because of better food, cleaner water, and new vaccines. However, the birth rate stays very high because people are still used to having large families like their ancestors did. Because more people are living longer and fewer babies are getting sick, the total population starts to explode! This is often the most dramatic part of the whole model.
Many developing nations in parts of Africa and Asia are currently in this stage of the demographic transition model. You will see many children and young people in these areas, which brings a lot of energy to the country. The main challenge for leaders in Stage 2 is building enough schools and houses for all the new people. It is a time of big changes as villages turn into cities and factories begin to appear. It shows that a nation is winning the fight against hunger.
Why Growth Happens in Stage 2:
- Improved Sanitation: Clean water and sewers stop the spread of dangerous germs.
- Better Nutrition: New farming tools help grow more food for everyone to eat.
- Medical Advances: Vaccines and antibiotics save millions of lives every year.
- Lower Infant Mortality: More babies grow up to become healthy adults.
- Stable Government: Peace allows people to focus on building better lives.
Stage 3: The Shift Toward Smaller Families
As a country moves into Stage 3, the way people think about their families begins to change. The birth rate finally starts to drop because people move into cities where large families are expensive. In the city, children don’t need to work on farms, so parents choose to have fewer kids. Also, more women go to school and get jobs, which means they start their families a bit later in life. The population still grows, but it does so much more slowly now.
This stage is a very positive sign that a country is becoming wealthy and more stable. You will see better offices and higher-level schools being built for the citizens during this time. Countries like Mexico and India are great examples of nations moving through Stage 3 right now. People start to focus on the quality of life for each child rather than just having many children. It is a time of balance where the old ways of life meet the new modern world.
Changes Seen in Stage 3:
- Urbanization: People move from small farms to big, busy cities for work.
- Women’s Education: More girls go to school and plan for professional careers.
- Access to Healthcare: Families have better ways to plan when to have babies.
- Higher Cost of Living: Raising children in the city costs more than on a farm.
- Industrial Jobs: Most people work in factories or offices instead of fields.
Stage 4: A Stable and Modern Society
Stage 4 is where many wealthy countries like the United States, Canada, and much of Europe are today. In this stage, both birth rates and death rates are very low, making the population very steady. Most families only have one or two children, and people live very long lives into their 80s or 90s. The growth line on the demographic transition model becomes almost flat here. This shows that the country has reached a high level of development and comfort.
One interesting part of Stage 4 is that the average age of the population starts to go up. Since people live longer and fewer babies are born, you see many more elderly people than in earlier stages. This changes how a country works because they need more doctors for seniors and fewer teachers for toddlers. It is a time of peace and high technology, but it also brings new puzzles for leaders to solve. Keeping a strong economy with an older population is a major goal today.
Features of Stage 4:
- Zero Growth: The birth rate and death rate are almost the same.
- Strong Economy: Most people have good jobs and access to modern technology.
- Advanced Medicine: High-tech hospitals help people live very long lives.
- High Literacy: Almost everyone in the country knows how to read and write.
- Small Families: Having only one or two children is the most common choice.
Stage 5: The Challenge of a Shrinking Population
Some scientists have added a fifth stage to the demographic transition model stages to explain what is happening now. In Stage 5, the birth rate actually drops below the death rate, which is very surprising. This means that the total population of the country starts to get smaller every year. This is happening in places like Japan and Germany because people are very focused on their careers and city lives. It is a brand-new situation in human history that we are still learning about.
Stage 5 is a big challenge because there might not be enough young workers to help run the country in the future. However, it can also be good for the environment because there is less pressure on nature and resources. Some countries try to fix this by encouraging people to move there from other nations or giving rewards for having babies. It is the final frontier of the model and shows us that the story of human population is always evolving and changing.
Facts About Stage 5:
- Negative Growth: The population gets smaller over time because births are low.
- Aging Society: There are many more retired people than young workers.
- High Technology: Robots and AI are often used to help do work since people are fewer.
- Urban Density: Most people live in highly advanced, crowded metropolitan areas.
- New Policies: Governments create new laws to help support their older citizens.
Detailed Comparison Table of the DTM
To help you understand these stages better, I have created a detailed table. It shows the differences between each stage so you can compare them at a glance. This is very helpful for school or for quick learning!
| Stage | Birth Rate | Death Rate | Growth Rate | Primary Cause of Change | Example Country |
| Stage 1 | Very High | Very High | Very Low | Lack of medicine and food | Historical only |
| Stage 2 | High | Falling Fast | Rapid Rise | Better water and sanitation | Niger / Mali |
| Stage 3 | Falling | Falling Slow | Slowing Down | More education and cities | India / Mexico |
| Stage 4 | Low | Low | Stable | Modern life and small families | USA / France |
| Stage 5 | Very Low | Rising Slightly | Decreasing | Very old population | Japan / Italy |
How Technology Drives the Demographic Transition
Technology is the main engine that moves a country through the demographic transition model. When a nation gets new tools to clean its water, the death rate drops almost immediately. Later, when technology makes city life easier, people choose to have fewer children. This shows that the way we build things directly affects how many people live on our planet. It is amazing to see how a simple invention like a vaccine can change the history of an entire nation.
In the future, new technology like AI and green energy might change the model even more. We might find new ways to stay healthy for even longer, or ways to make living in cities much cheaper. This could lead to a “Stage 6” that we haven’t even imagined yet! By studying the demographic transition model, we stay prepared for these big changes. It reminds us that humans are very good at adapting to new situations and making life better for the next generation.
The Role of Education and Empowerment
One of the biggest reasons birth rates drop in Stage 3 and Stage 4 is education. When girls and women go to school, they learn about health and careers, which gives them more choices. They often choose to have children later in life so they can finish their studies and start a job. This is a very powerful shift that improves the economy of the whole country. Education is like a key that unlocks a more stable and healthy population for everyone.
When people are educated, they also take better care of their own health and the health of their kids. This keeps the death rate low and ensures that every child has a bright future ahead of them. This is why many organizations work hard to build schools in developing nations. They know that education is the fastest way to help a country move through the demographic transition model. It creates a cycle of success that helps the entire world become a more peaceful and prosperous place.
Why Every Nation’s Path is Unique
Even though the demographic transition model is a great guide, every country has its own special story. For example, some countries in Europe took 200 years to go from Stage 2 to Stage 4. However, some countries in Asia did it in only 50 years! This is because they could use technology that was already invented by others. This shows that the world is more connected now than ever before, and we can learn from each other to grow faster.
Sometimes, a war or a natural disaster can slow a country down, but they usually get back on track quickly. Culture also plays a big role, as some societies value large families more than others do. This means the lines on the graph might look a little different for every nation you study. But the general pattern of the demographic transition model remains the most accurate way to see the big picture. It is a beautiful mosaic of human life spread across the entire globe.
Frequently Asked Questions (FAQs)
What is the demographic transition model definition?
The demographic transition model definition describes how populations change as a country develops. It focuses on the shift from high birth and death rates to much lower ones as a society gets wealthier and healthier over time.
Which stage has the most rapid population growth?
Stage 2 has the fastest growth because the death rate falls quickly due to better medicine, but the birth rate stays very high. This creates a large gap that results in a huge increase in the number of people.
Why do birth rates drop in Stage 3?
Birth rates drop in Stage 3 because more people move to cities where children are not needed for farm work. Additionally, women gain more access to education and jobs, leading them to have fewer children.
What is the main difference between Stage 4 and Stage 5?
In Stage 4, the population is stable because births and deaths are equal. In Stage 5, the birth rate falls below the death rate, which causes the total population of the country to start shrinking.
How does the model help AP Human Geography students?
It is a core part of the demographic transition model ap human geography curriculum. It helps students understand how population, health, and wealth are all connected in every country around the world.
Can a country move backward in the stages?
While it is very rare, a major crisis like a total war or a massive famine could potentially cause a country to move backward. However, most nations move forward as they gain more technology and better healthcare.
Conclusion: Understanding Our Shared Journey
The demographic transition model is a wonderful way to see how far we have come as humans. It tells a story of progress, from a time when life was short and difficult to a modern world of health and stability. By learning about these stages, we can understand the challenges that different countries face today. It helps us see that we are all on the same path toward a better and more secure future for our families.
As we look forward into 2026, these population trends will continue to shape our world in big ways. Whether a country is growing fast or starting to shrink, the lessons of the model help us stay prepared. I hope this guide has made the demographic transition model feel simple and interesting for you! If you enjoyed this article, why not look up your own country and see which stage it is in right now? Let’s keep learning about our amazing world together!